Dynamic Time
Warping-Based
Imputation
Dynamic Time
Warping-Based
Imputation
MASS 1 - 2019
MASS 3 - 2022
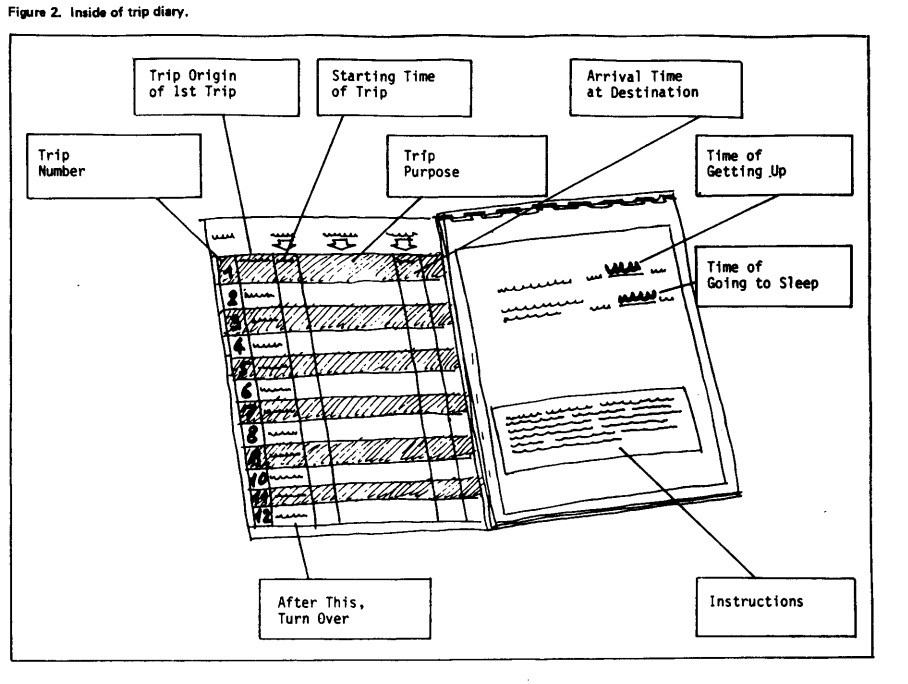
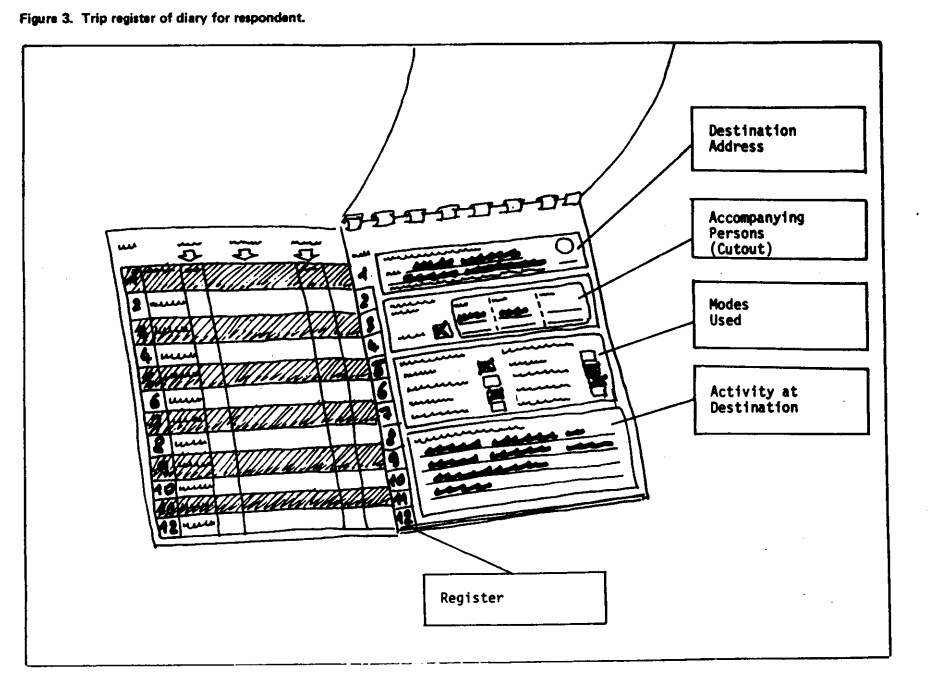
Travel Diary Studies were once future tech
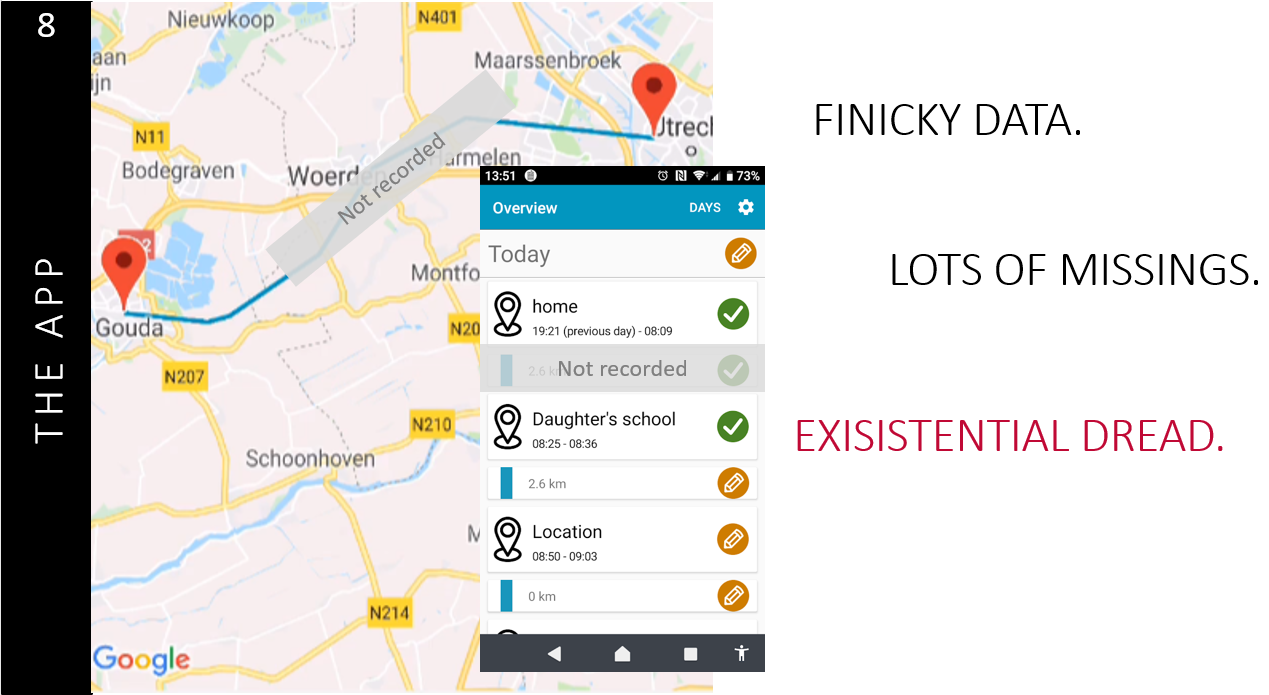
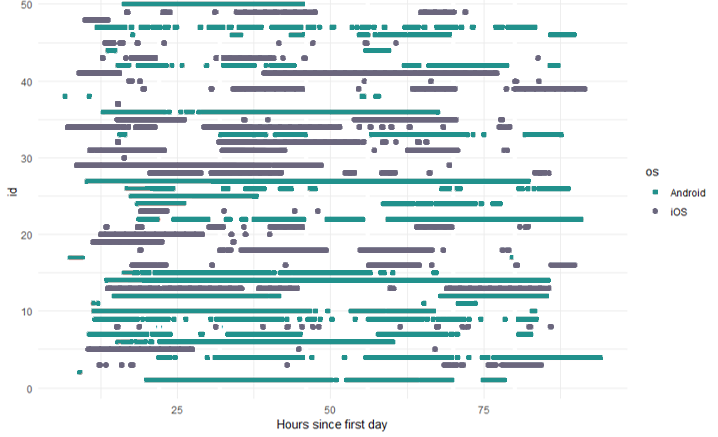
Data from the app
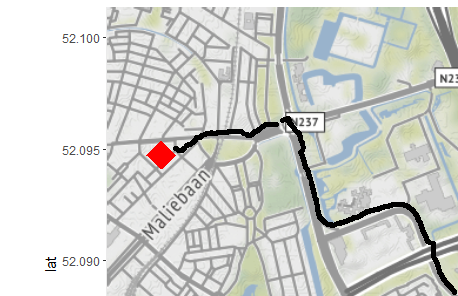
Data from the app
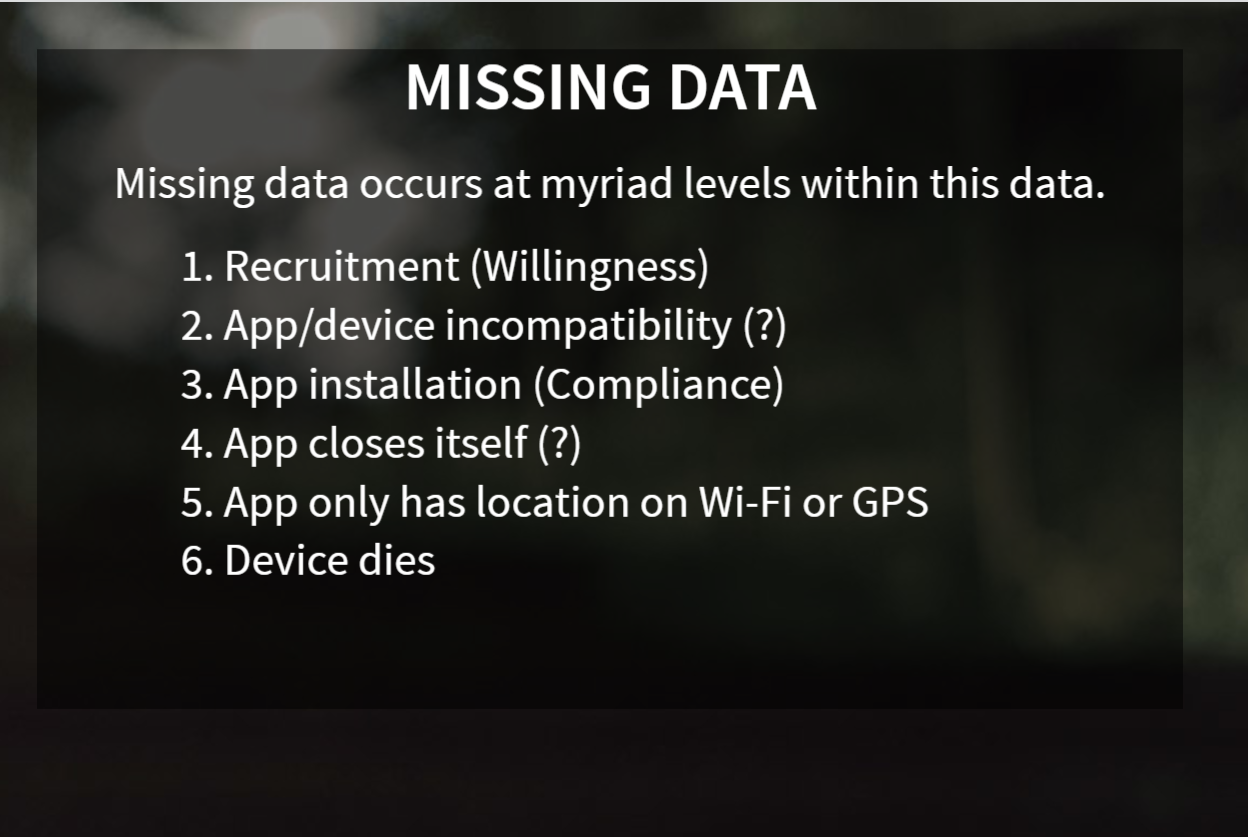
Missing data
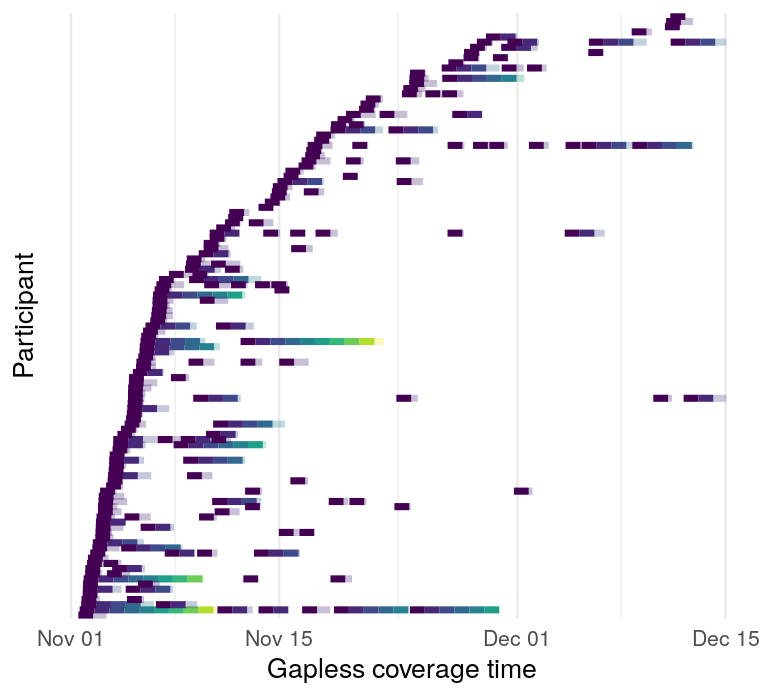
- Most people have missing data
- Only 2 of 274 respondents had 7 contiguous days of complete data
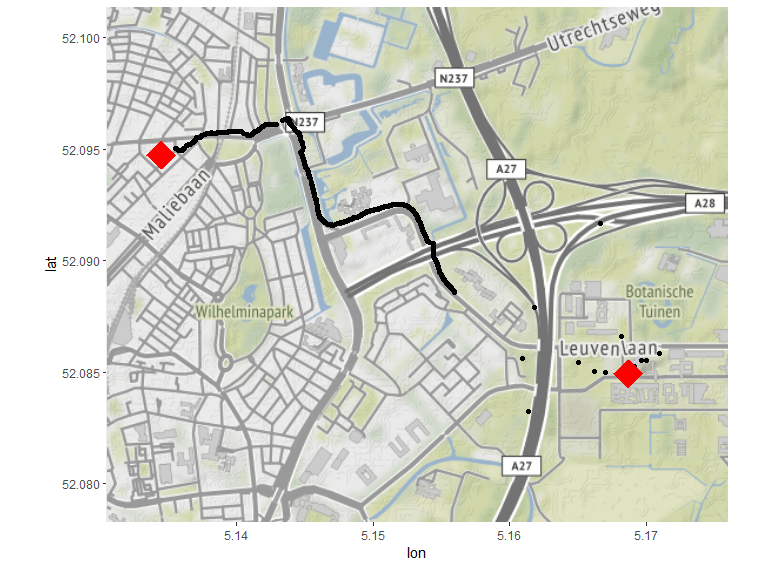
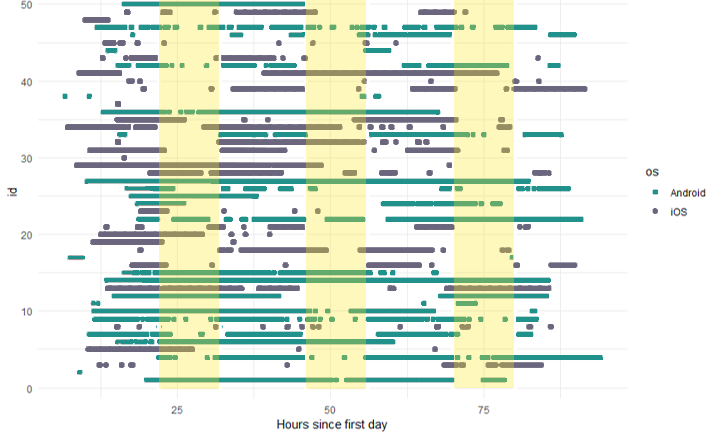
Gaps in the data
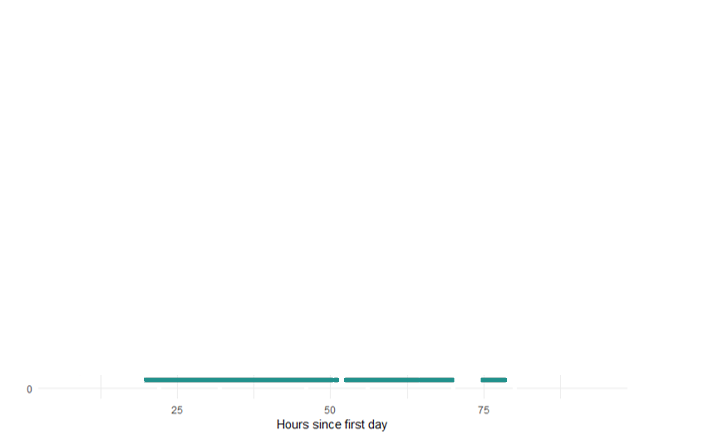
Gaps in the data
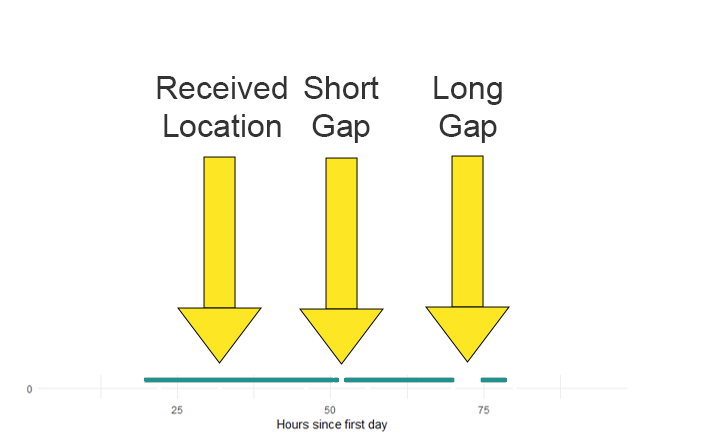
Many long gaps
Long gaps at night
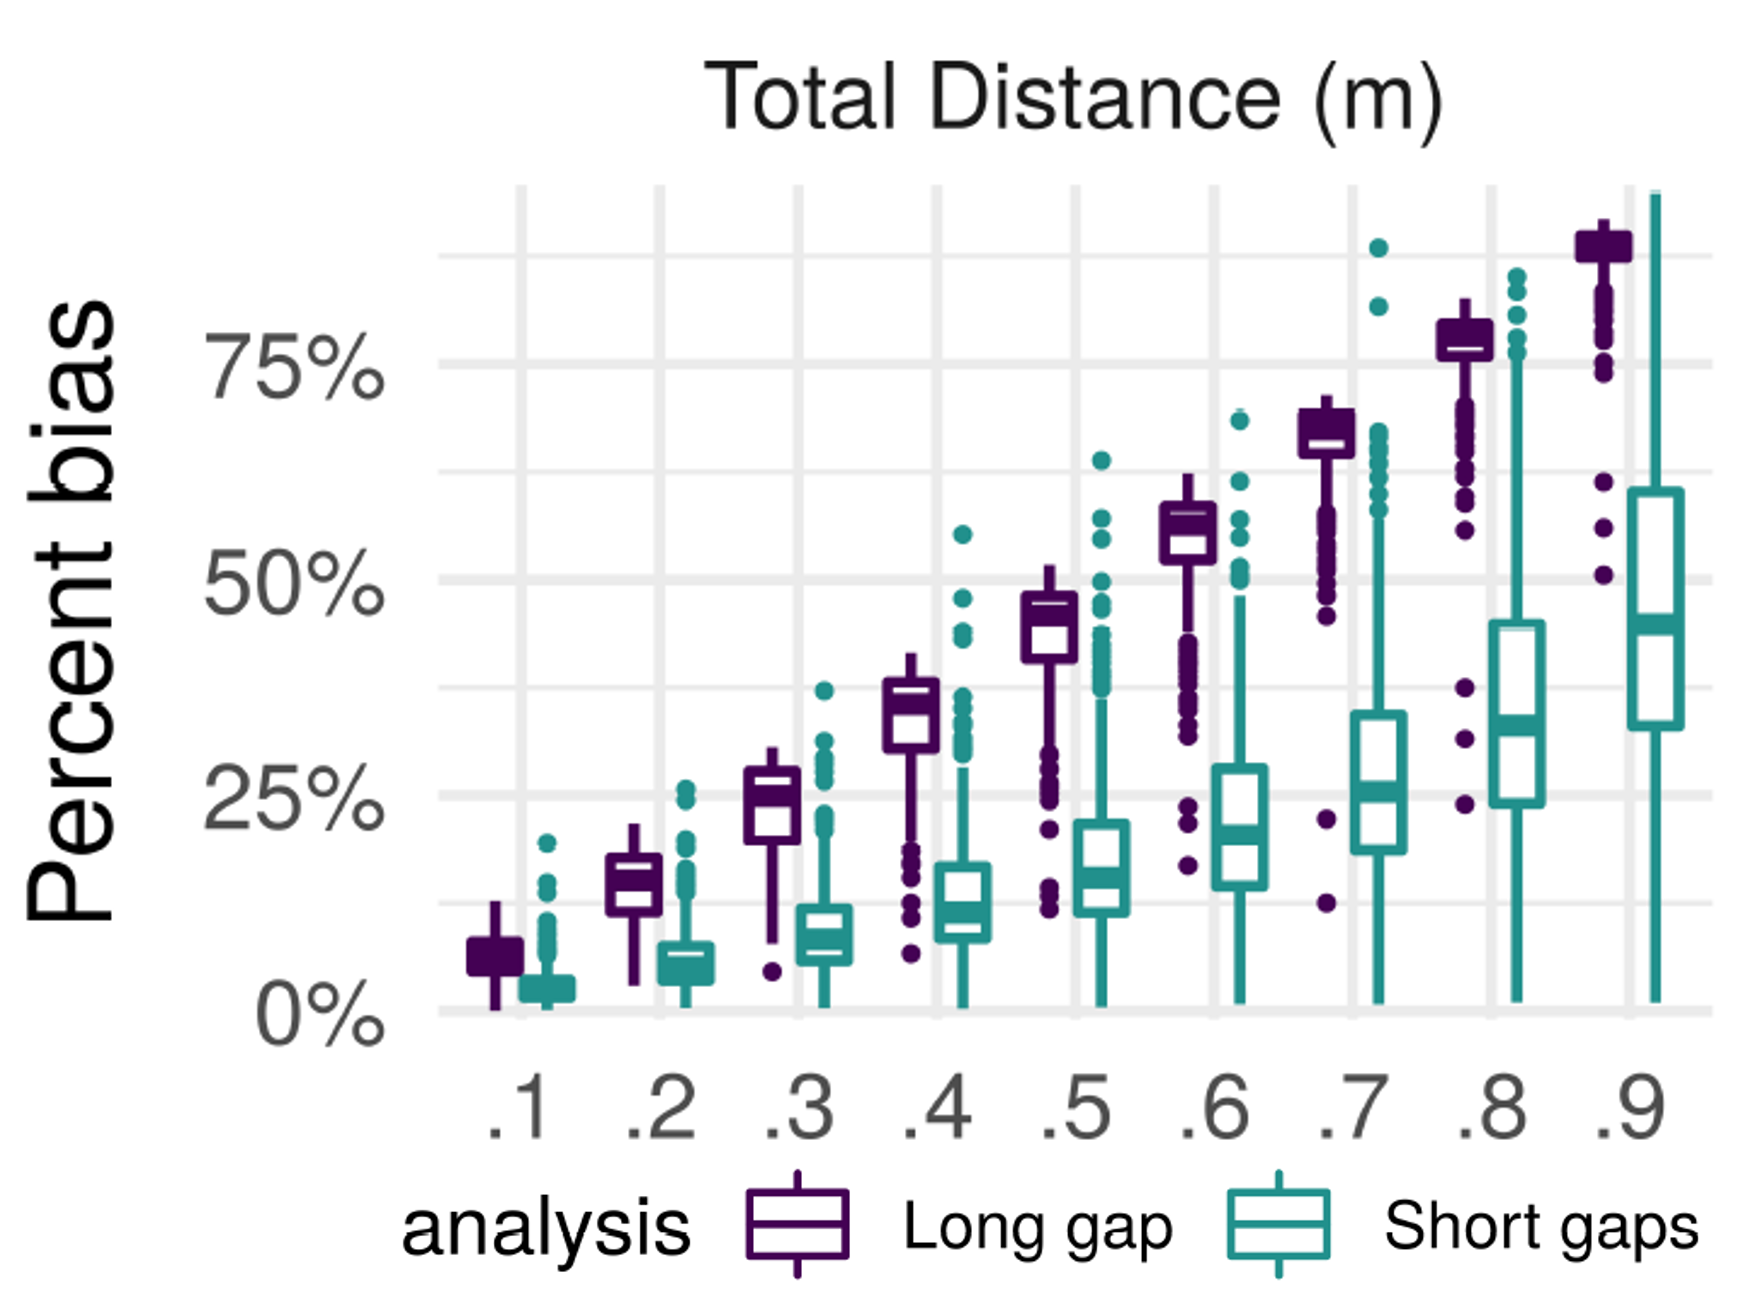
Method 1: Long gaps less so
The imputation procedure
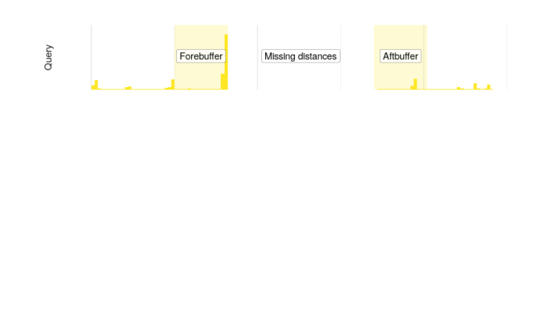
A query is the trajectory with a gap
The imputation procedure
We need data to fill the gap from other (complete) trajectories
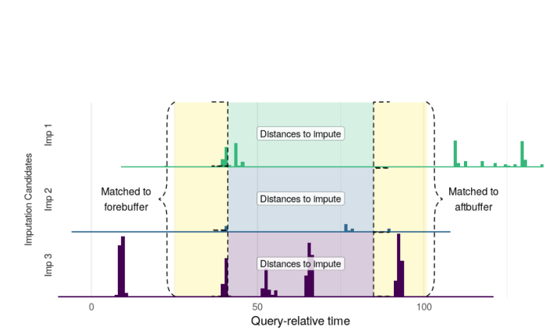
The imputation procedure
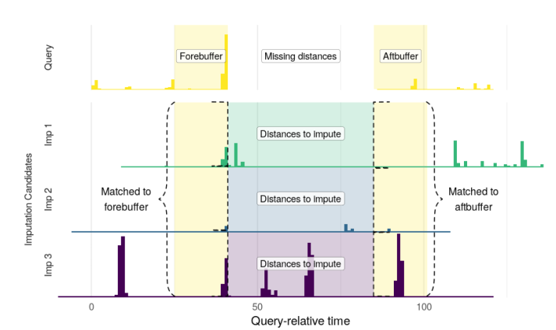
We calculate how similar trajectories are before and after the gap using Dynamic Time Warping
What is Dynamic Time Warping

Dynamic Time Warping finds the path of best alignment between two series
What is Dynamic Time Warping

There are lots of ways to specify its parameters